
Skip to content
Experience Real-time Pulse Monitoring

Monitor the heartbeat
of your services

Automated heartbeat checks every 5 minutes for your microservices. Keep track of service health with monitoring and beautiful dashboards.

  • Real-time monitoring
  • Instant alerts
  • Beautiful dashboards
Features

Everything you need to monitor your services

Keep your microservices healthy and monitored with powerful features designed for modern teams.

Real-time Checks

Ping your services every 5 minutes with automated heartbeat monitoring. Never miss a service outage.

Latency Alerts

Get notified immediately when response times exceed your thresholds. Set custom latency limits per service.

Status Verification

Ensure correct HTTP response codes. Monitor expected status codes and catch errors before they impact users.

Simple Configuration

Add services, set thresholds, and we do the rest. Intuitive dashboard with minimal setup required.

Platform

Built for reliability

Everything you need to monitor and maintain your microservices infrastructure with confidence.

Real-time monitoring

Get instant alerts when your services go down or exceed latency thresholds.

Easy setup

Add your services in minutes with our intuitive dashboard and simple configuration.

Detailed analytics

Track latency trends, response times, and service health over time with comprehensive charts.

Custom thresholds

Set your own latency and status code expectations for each service.

Automated checks

Continuous heartbeat monitoring runs automatically every 5 minutes.

Modern interface

Clean, intuitive dashboard designed for quick status checks and detailed analysis.

How it works

Monitoring in three simple steps

Go from zero to full visibility without agents, SDKs, or complex setup.

1

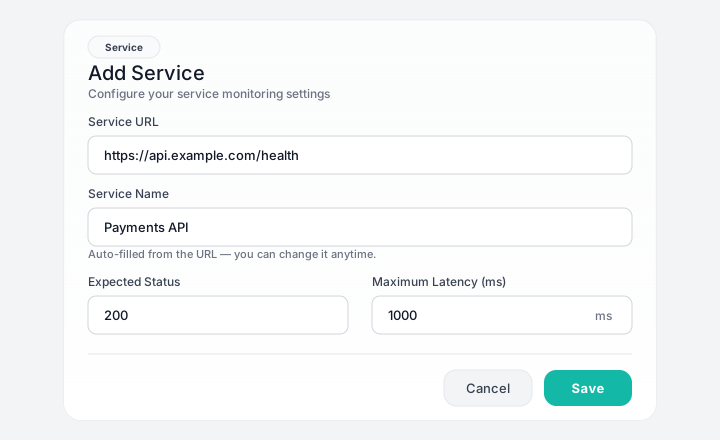
Add your service

Enter your endpoint URL, expected HTTP status, and latency threshold in the dashboard — no agents, SDKs, or code changes required.

TwoPulse Add Service modal with URL, status, and latency fields
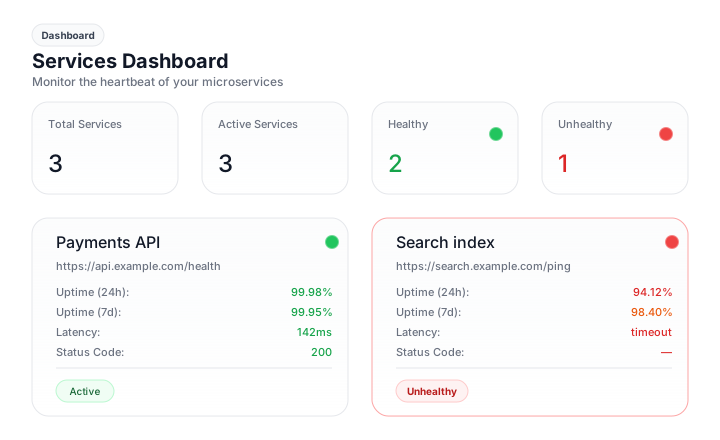
TwoPulse dashboard with service health cards and uptime metrics
2

We run heartbeat checks

TwoPulse pings your endpoints every 5 minutes and records latency, status codes, and uptime on your dashboard — healthy and unhealthy services at a glance.

3

Get alerted instantly

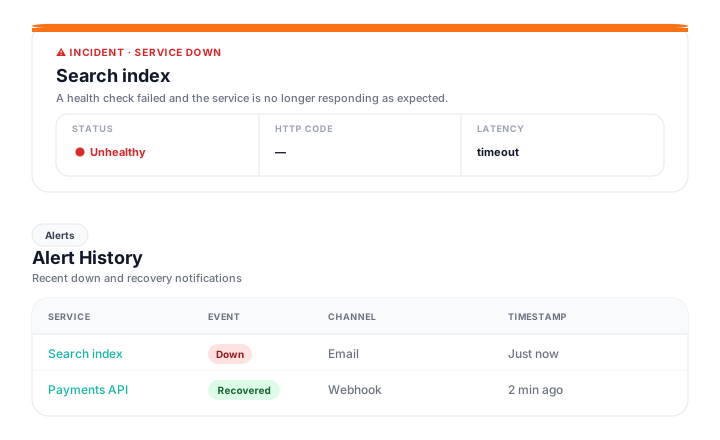
When thresholds are breached, you receive email or webhook alerts with incident details — and every notification is logged in alert history.

TwoPulse down alert email and alert history table
Latest Insights

From Our Blog

Expert insights on microservices monitoring, service health checks, and DevOps best practices.

Pricing

Simple, transparent pricing

Choose the plan that fits your team's needs. All plans include our core monitoring features.

Starter

$29 /month

Perfect for small teams getting started with service monitoring.

5 Services
Monitor up to 5 services
Real-time Monitoring
Heartbeat checks every 5 minutes
Email Alerts
Get notified when services fail
API Access
Limited API access
Most Popular

Pro

$79 /month

Ideal for growing teams with multiple services to monitor.

15 Services Included
Add more at $5/service/month
Advanced Analytics
Deep insights and custom reports
Priority Support
24/7 priority email and chat support
Full API Access
Complete API access with higher rate limits
Partners

Works with your stack

Docker
Kubernetes
AWS
Google Cloud
Azure
Redis
PostgreSQL
Docker
Kubernetes
AWS
Google Cloud
Azure
Redis
PostgreSQL
FAQ

Frequently asked questions

Everything you need to know about monitoring your services with TwoPulse.

What is TwoPulse?

TwoPulse is a service monitoring platform that runs automated heartbeat checks against your microservices and APIs. It tracks latency, verifies HTTP status codes, and sends alerts the moment a service becomes unhealthy.

How often does TwoPulse check my services?

TwoPulse continuously runs heartbeat checks on a regular interval, around the clock. Every check records the response latency, the returned status code, and whether it passed your configured thresholds.

What kinds of alerts can I receive?

You can receive email alerts and webhook notifications (for tools like Slack or Discord) when a service goes down, returns an unexpected status code, or exceeds your latency threshold for several consecutive checks.

Do I need to install an agent or change my code?

No. TwoPulse checks your services from the outside over HTTP, so there is nothing to install. Just add your endpoint URL, set your expected status and latency, and monitoring begins.

How long is my monitoring history kept?

Heartbeat history is retained for roughly 13 months, so you can review latency and uptime trends over time and spot recurring issues across your services.

Still have questions? Contact us

Get Started

Ready to get started?

Set up monitoring for your services in minutes with TwoPulse.